
 568k
568k  233k
233k  41k
41k  Subscribe
By Bentham Paulos
Renewable electricity records are being broken every day. In early October, Germany hit a 59 percent renewable peak, Colorado utility Xcel Energy peaked at 60 percent wind at the beginning of the year and Spain got its top power supply from wind for three months leading into 2013.
But that’s chump change compared with Denmark. According to data from Energinet, the national grid operator, wind power has produced 30 percent of gross power consumption to date in 2013. This includes more than 90 hours where wind produced more than all of Denmark’s electricity needs, peaking at 122 percent on Oct. 28, at 2 a.m.
And Denmark has plans to get to 50 percent more wind by 2020, creating even bigger hourly peaks. Energinet predicts the country may hit as many as 1,000 hours per year of power surplus.

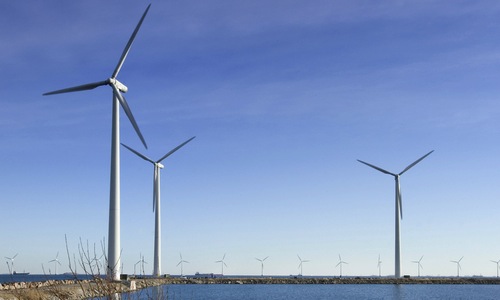
Photo courtesy of Shutterstock
To champions of renewables, this is validation that a clean energy future is possible and that the transition is already underway. These regions also give insight into what is to come in the U.S., and what needs to change to keep a reliable and affordable power system as clean energy grows.
Postcards from the future
As part of America’s Power Plan, we have developed a series of “postcards from the future,” describing places like Denmark that are already grappling with a high-renewables future.
Studies and real-world experience are underscoring that there are many tactics available to deal with the variability of wind and solar, and that these tactics are largely substitutes for each other.
While energy storage comes to mind first for many people, the truth is that the grid has functioned just fine with very little storage. Power system operators have to deal with variability all the time, with or without renewables. Demand fluctuates with the weather, time of day, social activities, and industrial operations. And supply varies unexpectedly too, such as when a power plant breaks down. The fluctuations of wind and solar, especially at moderate levels, are just one more variable—one that may or may not add to overall variability, depending on the system and timing.
Power system engineers use a whole suite of tools to match supply and demand, both minute-to-minute and over longer time frames. The most obvious example is a dispatchable power plant, like a gas turbine. But they also benefit from bigger balancing areas (trading power with neighbors), more transmission connections to reduce congestion, faster-acting fossil power plants, direct load control and demand response, targeted energy efficiency, and curtailment of wind and solar plants.
Hydro power and even fossil fuels are the traditional forms of energy storage, but many more are emerging, such as using power to heat district heating systems, compressed air, batteries and flywheels, and charging electric cars during the renewable peak.
It is increasingly common to treat wind power as a controllable generator, rather than just letting it go full out. System operators in New York, Texas and the Midwest direct wind farm owners to submit five-minute forecasts of output, and ramp up and down if necessary to meet system demands, just like conventional generators. The Midwest ISO enforces this with a “dispatchable intermittent tariff.”
Making it work: Easy Solutions First
So how can Denmark be 122 percent wind-powered? Where does the extra power go?
Denmark is part of an integrated regional grid with the Scandinavian countries and parts of Germany. They have a constant trade with utilities in the region, especially hydro plants in Norway.

As renewables grow and as Denmark attempts to phase out fossil fuels altogether by 2050, the country is aggressively adopting smart grid technologies, leading Europe in research and demonstration projects on a per-capita basis. The island of Bornholm will be a test bed, with extensive smart grid and renewable energy deployment. Demand response is beginning to grow, though in a different form than in the U.S. Denmark also has big goals for electric cars, and has exempted them from the 180 percent sales tax applied to gas and diesel vehicles.
But conventional solutions will be the first solution through better grid links between countries. As Germany’s Agora Energiewende has put it in its 12 Insights report, “Grids are cheaper than storage facilities.” More grid connections allow surplus power to be shipped off rather than curtailed or stored. Larger balancing areas reduce the variability of wind and solar across a wider geographic area. Agora thinks storage will only be necessary when renewables constitute 70 percent of total supply.
As in the U.S., European regulators are grappling with policies to integrate large amounts of renewables. While technical issues remain, they are not really new, only of a larger scale. Most of the integration tools are known; they just need to be bigger and more capable to deal with bigger variations.
Less known are the policy issues. How big should control areas be? How much should be invested in transmission lines, and who should pay for them? What is the relative value of energy payments, versus capacity payments or ancillary services? Most of all, how should we pay for the services we need to keep the lights on?
In America’s Power Plan, Mike Hogan of the Regulatory Assistance Project calls for aligning power markets with clean energy goals, giving proper incentives for market flexibility.
With 2020 just around the corner, it will be instructive to see how Denmark deals with getting half its electricity from the wind. What will the country do with a 200 percent wind day?
Bentham Paulos is the project manager for America’s Power Plan.
Author’s note: A number of system operators have put their real-time data online and in iPhone apps, so you can track hourly progress on renewables.
Energinet (Denmark): Real time map and historical data
National Grid’s NETA (England): Data sources
California ISO: Daily demand graph and iPhone app
ISO New England: Guest dashboard
Midwest ISO: Contour pricing map
Visit EcoWatch’s RENEWABLES page for more related news on this topic.
