
 568k
568k  233k
233k  41k
41k  Subscribe
By Ted Auch
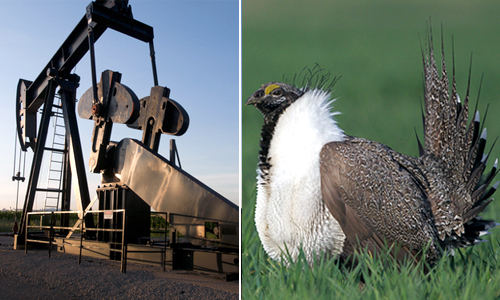
The New York Times’ Diane Cardwell and Clifford Krauss recently published a piece on the interaction between the Greater Sage Grouse (GSG, Centrocercus urophasianus) and fracking in Big Sky country. We thought it might be helpful to dig a little deeper into the issue given the sensitivity of this species’ as well as the Lesser Prairie-Chicken (Tympanuchus pallidicinctus) to habitat disturbance and the inevitable conflict between “energy independence” and the Endangered Species Act—the purpose of which “is to protect and recover imperiled species and the ecosystems upon which they depend.”
Gunnison Sage Grouse
We looked at the GSG’s range relative to hydrocarbon wells in Colorado and Wyoming keeping in mind the bird’s range encompasses 11 states and “more than 165 million resource-rich acres.” This analysis encompasses much of the bird’s range accounting for 52 percent (134,149 square miles) of the aforementioned acreage (Figures 1 and 2) and 37 and 373 GSG habitat parcels in Wyoming and Colorado, respectively.
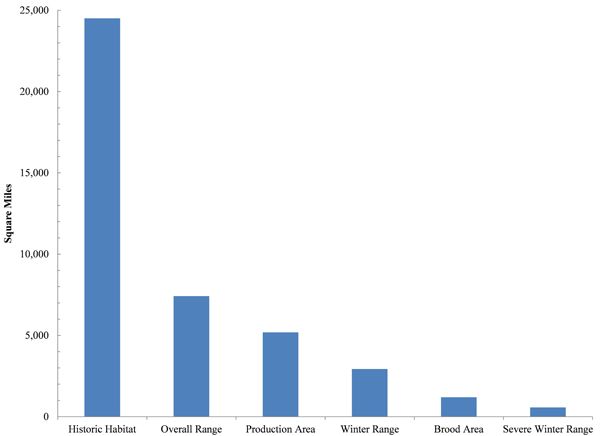
The largest shaded areas on the map are the bird’s “Current Distribution” (67,879 square miles) in Wyoming and “Historic Habitat” in Colorado (24,505 square miles). GSG’s range in Colorado is far more spread out than in Wyoming with discrete north- and southwest concentrations. Important Birding Areas (IBAs) as defined by the Audubon Society often overlap with oil and gas extraction sites as well as endangered species habitat. Thanks to the Audubon Society’s Connie Sanchez and Tom Auer we were able to determine how many hydrocarbon production wells exist within these states’ IBA parcels. Wyoming is home to 39 IBAs, while Colorado contains 53 of these designated parcels. The average Wyoming IBA is 257 square miles, however, while Colorado’s average 59 mi2. In total these two states are home to 13,154 mi2worth of IBAs. These figures account for 3.7 percent of U.S. IBAs and 2.2 percent of IBA acreage.

1. Wyoming: 51 unconventional hydrocarbon wells in IBAs, 2,238 in primary GSG habitat, and for some perspective 1,983 of the latter are in what EIA has designated primary shale plays. At the present time 97 percent of Wyoming’s production wells lie within some segment of the GSG’s habitat.
2. Colorado: 163 unconventional hydrocarbon wells in IBAs
- Southwest: 7,838 wells in primary GSG habitat
- Northwest: 16,609 wells in primary GSG habitat
- EIA Shale Plays: 24,178 wells
- 53 percent of Colorado’s production wells lie within some segment of the state’s GSG habitat.
In Colorado, the GSG’s historical habitat has already been overrun by hydrocarbon wells with 20,809 across the bird’s north- and southwest range. The bird’s production/brooding area in the northwest contains 1,142 wells while its winter range contains 662 wells.
Figure 2. Wyoming hydrocarbon production laterals and Greater Sage Grouse Habitat.
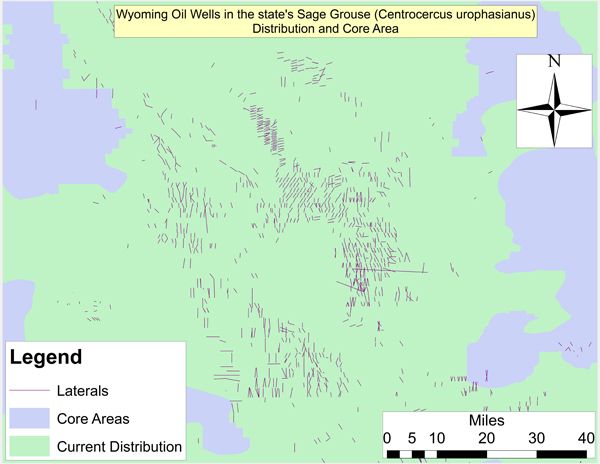
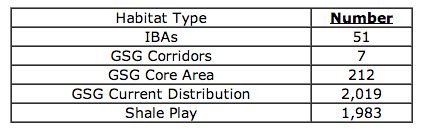
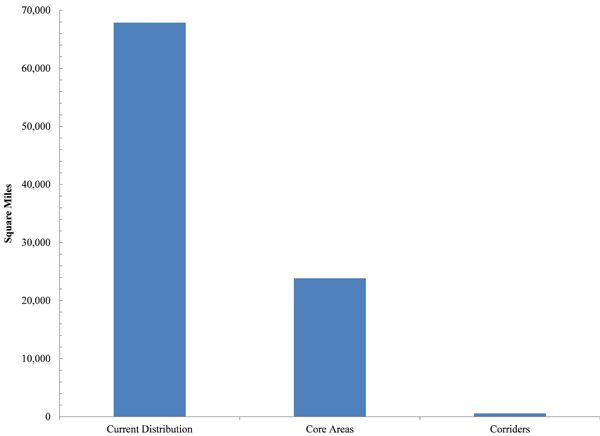
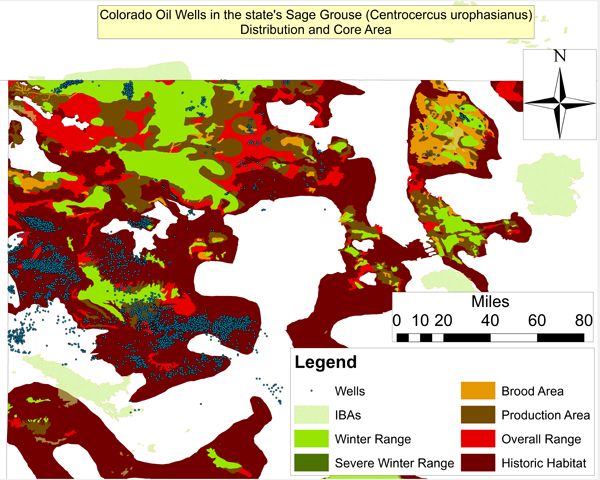
Table 2. Colorado hydrocarbon production wells in various sectors of the Greater Sage Grouse’s range.

Historic Range
Another way to look at the interaction between hydrocarbon production and GSG in the Great Plains and Pacific Northwest is to investigate the density of wells in the bird’s historic range. That is precisely what we did for the 16 states where GSG once roamed. The bird’s historic range is 2.21 times the size of its current range, while the acreage we analyzed is slightly more than the often-reported “165 million resource-rich acres” (Cardwell and Krauss, 2014). On average each of the 16 states was home to 35,580 square miles of GSG habitat and are now home to a mere 28 percent of that figure.
While GSG habitat in these states has decreased, hydrocarbon production has skyrocketed. There are currently 153,358 hydrocarbon wells across the 16 states and an average of 12,780 wells per state—excluding the four states devoid of wells in GSG habitat[1]. These wells and associated infrastructure occupy approximately 39,649 square miles which is a disturbing 7 percent of the species’ historic range and nearly 15 percent of its current range. From an historic GSG range perspective, Kansas has the highest density of wells with 3.5 per square mile of habitat. Unsurprisingly North Dakota, has the highest density of wells in the bird’s current range, with 6.1 wells per square mile of habitat. Colorado was second in both departments with 1.1 and 2.9 wells per square mile of historic and current GSG habitat, respectively.
Lesser Prairie-Chicken
The Lesser Prairie-Chicken (LPC)—along with GSG—is hardly what anyone would call charismatic mega-fauna but it’s habitat is coming under pressure in the name of drill baby drill “energy independence” across many of the same Great Plains states. The Prairie-Chicken’s range once spread across 97,977 square miles in five states with 43 percent of that acreage in Kansas alone. The bird’s range has declined by 68 percent and as much as 78-79 percent in Colorado and New Mexico. In terms of US hydrocarbon production the Prairie-Chicken’s historic range is home to 58,152 wells, while its current extent contains 22,049 wells.
On average the four states we investigated sans Texas contain 14,538 and 5,512 wells in this bird’s historic and current range, respectively, with the largest values for both not surprisingly in the state that contains most of the bird’s primary grassland habitat Kansas’s southwest corner. Across these states the density of wells in Prairie-Chicken habitat is 0.603-0.682 hydrocarbon wells per square mile with as many as 1.06-1.25 wells per square mile of Prairie-Chicken habitat in New Mexico. These wells and related infrastructure have an approximate footprint of 22,378 square miles, which is 23 percent the LPC’s historic range and 72 percent of its current range.
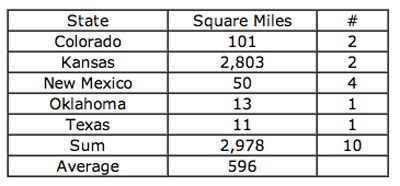
The five states that contain LPC habitat are also home to 2,978 square miles worth of IBAs across ten parcels averaging 596 square miles, with Kansas home to the most IBA acreage (1,793,845 acres) and New Mexico the most parcels (4 parcels). These values equate to 0.40 percent of US IBAs and 0.99 percent of IBA acreage.
Conclusion
What this analysis means for the GSG and LPC is hard to discern. It stands to reason, however, that their already sensitive mating behavior and plummeting/disconnected populations have not seen the last of energy independence’s encroachment. In contrast to the well-noted battle in the Pacific Northwest between environmentalists, loggers, developers and cattle grazers over the much smaller range of the Spotted Owl[2]—and the US Fish and Wildlife Service’s “”God Committee”—the GSG’s range includes much of the U.S.’s primary wind and mineral resource acreage. GSG’s habitat requirements overlap with US shale resources in a significant way with 29 percent of its range in shale basins and 11 percent in currently active shale plays. For a more detailed legal perspective on this issue the reader is referred to our friends at the Center for Biological Diversity and their long-term commitment to protecting and increasing suitable GSG habitat.
Meanwhile the historic and current range of the LPC is like the Spotted Owl in that it is quite small amounting to 97,978 and 31,237 square miles, respectively, which is approximately 11-17 percent of the GSG’s range. Similar to GSG we found that 31 percent of LPC’s historic range lies within shale basins while only percentage of its habitat is within currently active shale gas plays.
Table 3. Historic and Current Range of Greater Sage Grouse along with the number of producing hydrocarbon wells in that range by state.
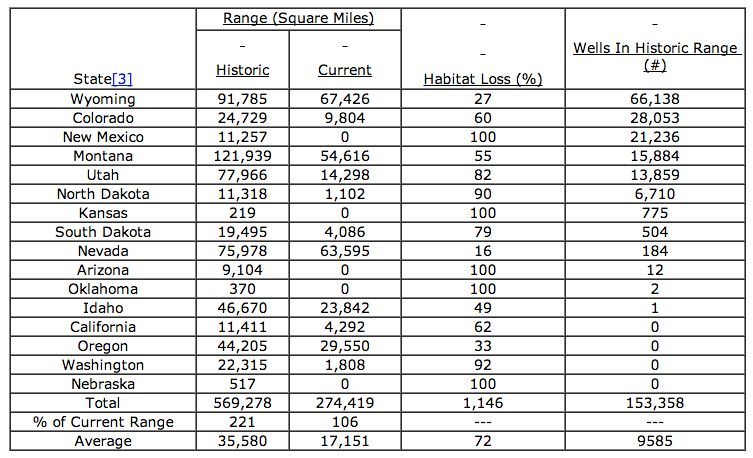
Table 4. Historic and Current Range of Lesser Prairie-Chicken along with the number of producing hydrocarbon wells in that range by state (Note: Texas well location data is not available at the present time).
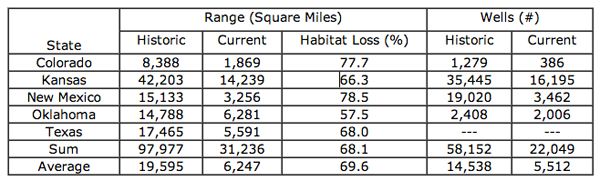
Table 5. Square mileage and number of Important Birding Areas (IBAs) in the Lesser Prairie-Chicken’s historic range.
You Might Also Like
GAO Report: Drinking Water at Risk from Underground Fracking Waste Injection