
 568k
568k  233k
233k  41k
41k  Subscribe
In the wake of the COP 21 UN climate summit in Paris, a number of important questions still remain unanswered. Take for example the commitment reached by the 197 participating nations to limit warming below the “dangerous” level of 2C relative to pre-industrial time (neglecting for the time being the aspirational goal of a substantially lower 1.5C limit acknowledged in recognition of the danger posed to low-lying island nations). The question immediately arises: How much time do we have until we reach the danger zone? How close are we to the 2C warming limit?
It has been widely reported that 2015 will be the first year where temperatures climbed to 1C above the pre-industrial. That might make it seem like we’ve got quite a ways to go until we breach the 2C limit. But the claim is wrong. We exceeded 1C warming more than a decade ago. The problem is that here, and elsewhere, an inappropriate baseline has been invoked for defining the “pre-industrial.” The warming was measured relative to the average over the latter half of the 19th century (1850-1900). In other words, the base year implicitly used to define “pre-industrial” conditions is 1875, the mid-point of that interval. Yet the industrial revolution and the rise in atmospheric CO2 concentrations associated with it, began more than a century earlier.
Unfortunately, even the Intergovernmental Panel on Climate Change (IPCC) has fallen victim to this problematic convention in their latest (5th) assessment report. The key graphic (Fig. 1 below) in the Summary for Policy Makers (“SPM”) of the report measures net anthropogenic (i.e. human-generated) carbon emissions and the resulting warming that can be expected. Both the emissions and warming and measured relative to an 1870 baseline.
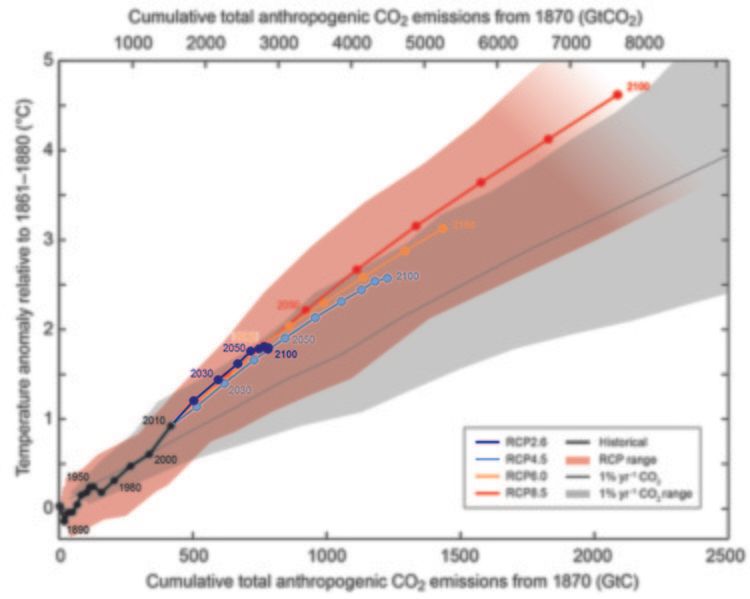
The various future emissions scenarios are called “RCP”s (for “Representative Concentration Pathways”) and they reflect varying assumptions regarding our future efforts to limit carbon emissions. The “RCP 2.6” scenario (dark blue), the most aggressive of the scenarios (from the standpoint of ramping down carbon emissions), corresponds to limiting net carbon emissions to about 3000 Gigatons (3 trillion tons) of CO2. We’ve already burned through about 2,000 Gigatons, i.e. we have expended two thirds of our apparent “carbon budget.”
Achieving those limits in emissions would in turn limit maximum atmospheric CO2 concentrations to just under 450 parts per million (“ppm”). Pre-industrial levels were about 280 ppm. Current levels are just above 400 ppm and increasing by about 2.1 ppm per year. At that rate, we’ll reach 450 ppm in a little over two decades. So obviously we need to reduce our carbon emissions rather rapidly if we are to avoid crossing the 450 ppm threshold.
The IPCC graphic suggests that keeping net CO2 emissions below 3 trillion tons—and thereby stabilizing maximum CO2 concentrations below 450 ppm—would likely keep warming below the “dangerous” 2C limit. Unfortunately, that conclusion is overly optimistic because, once again, it relies on the use of an artificially warm, too-recent baseline for defining the pre-industrial period.
To better understand the problem, consider this graph (Fig. 2 below) from an article my colleagues and I published in the American Meteorological Society’s Journal of Climate back in 2013.
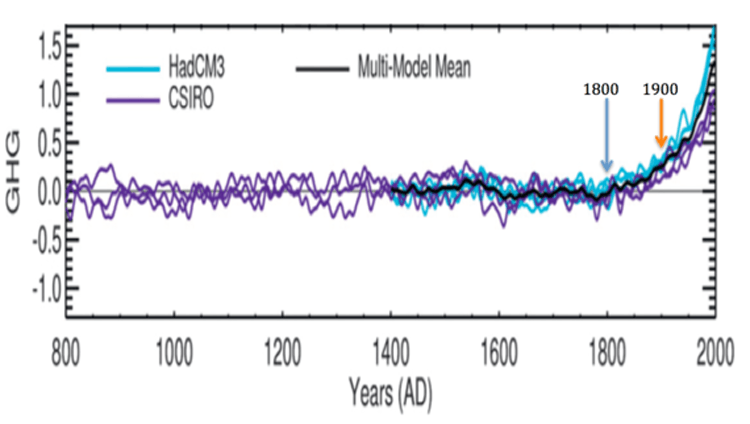
The graph shows the warming of the Northern Hemisphere (in degrees C) due to human-generated greenhouse gases (“GHG”) alone, as estimated by the various climate models used in the IPCC 5th assessment report (the black curve—the “multimodel mean” is the average over all of the climate model simulations that were done). The graph has been annotated to indicate the warming observed by 1800 and 1900. It is evident that roughly 0.3C greenhouse warming had already taken place by 1900, and roughly 0.2C warming by 1870. While that might seem like a minor amount of warming, it has significant implications for the challenge we face in stabilizing warming below 2C, let alone 1.5C, as we shall see below.
It is worth noting, incidentally, that this graph refutes an assertion recently made by climate change contrarian Judith Curry of Georgia Tech, during her remarks at a recent senate hearing where she appeared as a witness at the invitation of presidential hopeful and climate change denier Ted Cruz (R-TX). At the hearing, Curry bizarrely claimed that the rise in temperatures over the past 200 years is “not human” caused and that something other than industrial greenhouse gases is causing temperatures to climb. Examining the graph above, we can see that the statement is transparently false.
Now let us consider the implications that this all has for defining the limit of dangerous interference with the climate. In my Scientific American article last year Earth Will Cross the Climate Danger Threshold by 2036, I examined this precise question using a set of climate model simulations where the “equilibrium climate sensitivity” (ECS) of the model (how much warming one observes for a doubling of CO2 concentrations once the climate equilibrates to the rise) was varied. The results are shown in Fig. 3 below.
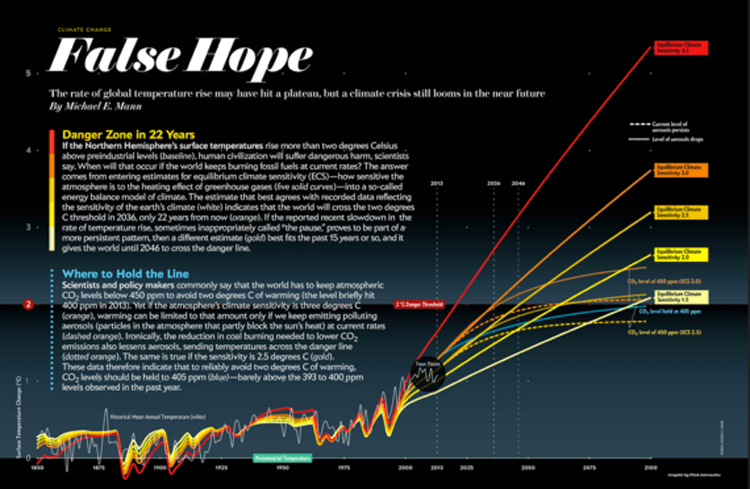
Source: Scientific American (2014)
In these simulations, I used a 1750-1850 base period to define the pre-industrial average temperature baseline. As we can see from Fig. 2, there is little evidence of greenhouse warming over this early period. I focused on the Northern Hemisphere where data are available to meaningfully extend the record that far back (this was based on using the “Berkeley Earth Surface Temperature” dataset which extends back to AD 1750; details of data, code, etc. are provided here).
There are a number of things to note from Fig. 3. First of all, using the more appropriate 1750-1850 pre-industrial baseline, we see that the Northern Hemisphere average temperature (gray squiggly curve) has already warmed nearly 1.2C. Temperatures have exceeded 1C above pre-industrial levels for most of the past decade. So 2015 obviously won’t be the first time this has happened, despite press reports to the contrary.
But let us return to the discussion of dangerous planetary warming. In the piece, I argued that the 3C value of ECS (i.e. where 3C warming of the globe ultimately results from increasing CO2 concentrations from their pre-industrial level of 280 ppm to a level of 560 ppm) is most likely given the various lines of scientific evidence. For this value of ECS I showed that limiting CO2 concentrations to 450 ppm (orange dashed curve in Fig. 3) would indeed limit warming to about 2C relative to pre-industrial. Problem solved? Not quite …
While greenhouse warming would abate, the cessation of coal burning (if we were truly to go cold-turkey on all fossil fuel burning) would mean a disappearance of the reflective sulphate pollutants (“aerosols“) produced from the dirty burning of coal. These pollutants have a regional cooling effect that has offset a substantial fraction of greenhouse warming, particularly in the Northern Hemisphere. That cooling would soon disappear, adding about 0.5C to the net warming. When we take this factor into account (orange dotted curve), the warming for 450 ppm stabilization is now is seen to approach 2.5C, well about the “dangerous” limit. Indeed, CO2 concentrations now have to be kept below 405 ppm (where we’ll be in under three years at current rates of emissions) to avoid 2C warming (blue dotted curve).
So evidently, we don’t have 1/3 of our total carbon budget left to expend, as implied by the IPCC analysis. We’ve already expended the vast majority of the budget for remaining under 2C. And what about 1.5C stabilization? We’re already overdrawn.
The more we delay rapid reductions in fossil fuel burning, the more we will need to offset additional carbon emissions by sequestration of atmospheric carbon, either through massive reforestation projects, or ‘geoengineering’ technology such as “direct air capture,” which involves literally sucking the CO2 back out of the atmosphere (It would be expensive, but the alternative—allowing dangerous planetary warming or implementing other potentially dangerous geoengineering schemes—could be far more costly).
Let’s summarize. We’re already close to 1.2C net warming for the Northern Hemisphere relative to a true pre-industrial baseline. If we were to suddenly halt all fossil fuel burning (and other human activities generating carbon emissions), then greenhouse warming would cease [interestingly, this is actually a consequence of two offsetting factors: there is future warming in the pipeline owing to the slow response of ocean warming to greenhouse gases, the so-called ‘committed warming.’ Offsetting this potential for additional future warming, however, is the fact that the ocean begins to absorb CO2 from the atmosphere, lowering CO2 concentrations. Recent work has argued that these two factors essentially cancel]. However, we would see another ~0.5C warming owing to the disappearance of sulphate pollutants, yielding 1.2C+0.5C = 1.7C total warming, perilously close to the 2C limit.
So what’s the bottom line? Well, we’re actually closer to the dangerous 2C warming mark than many experts acknowledge. And yet there is still hope for limiting warming to 2C despite claims to the contrary by some (see also this response).
Doing so would require rapid decarbonization of our economy and, perhaps, implementation of strategies and technologies for removing carbon from the atmosphere. If we decide that 2C is still too much warming, and seek a lower target of 1.5C, the challenge is more uphill. Reducing emissions alone won’t be adequate, and sequestration of atmospheric carbon will be critical.
We can do this. No, we must do this.